Information Systems Mapping Guide
An interactive map of a whole master's degree: nine courses, their theories and readings, and how they connect.
Abstract
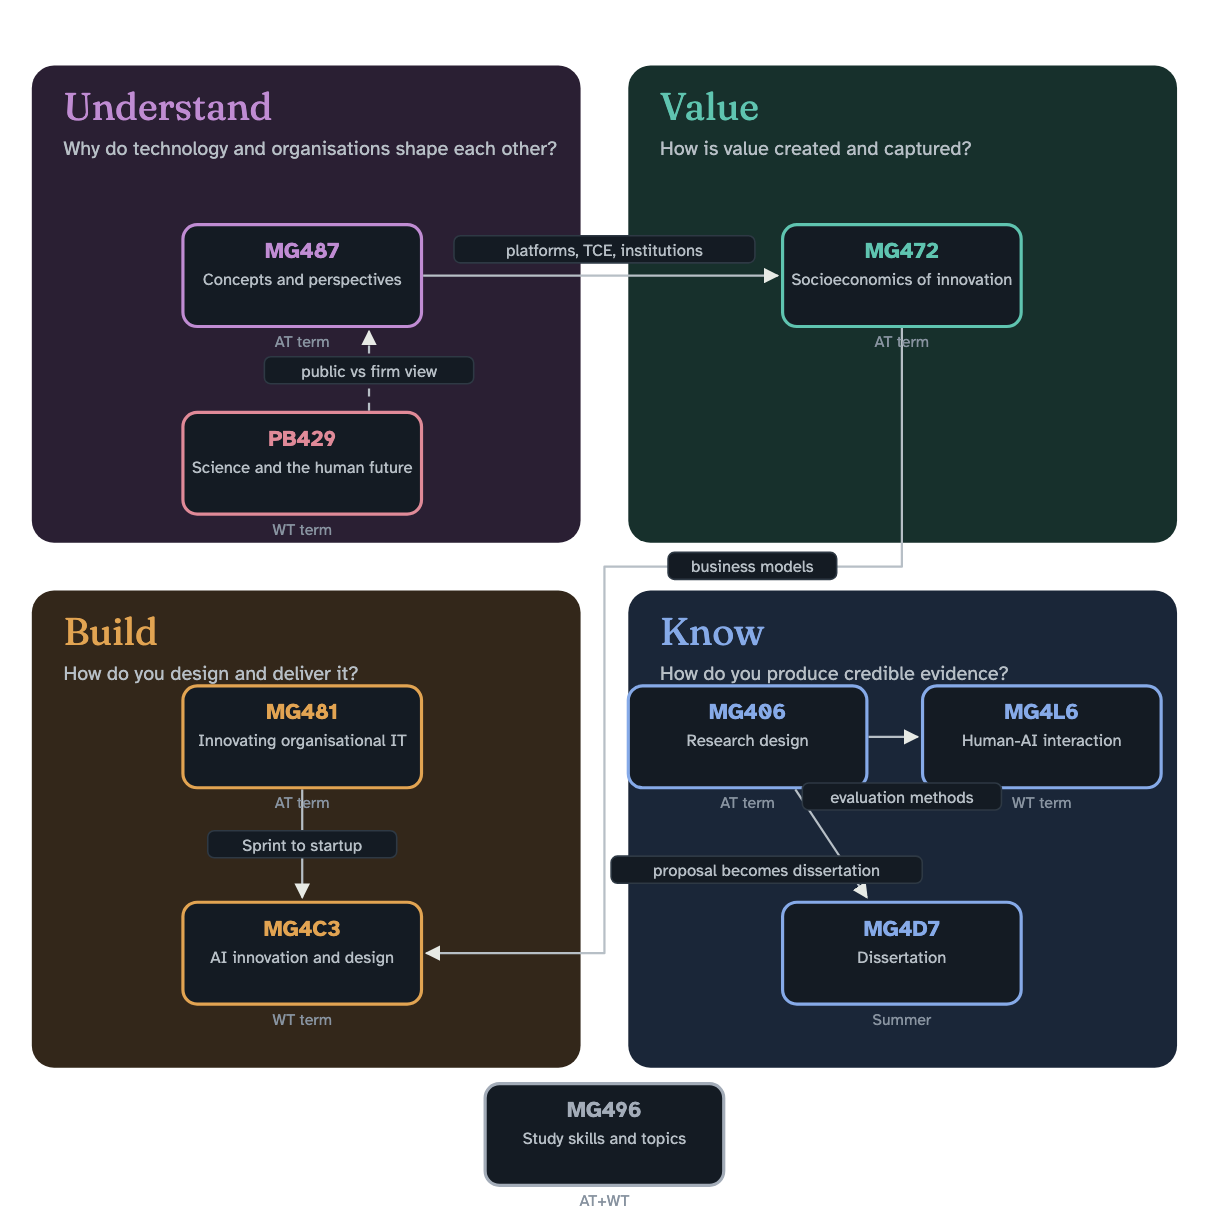
Nine courses in one year are hard to tell apart. This guide maps the MSc Information Systems & Digital Innovation @ LSE as one argument in four questions: how technology and organisations shape each other, how value is created, how to build, and how to know.
Every course, week, theory and reading sits on the map and can be clicked. It is one file that opens offline, rebuilt from structured notes whenever a course publishes something new.
Technical overview
- Content
- Nine course dossiers, about 80 theories and 153 reading notes, each with its source marked.
- Views
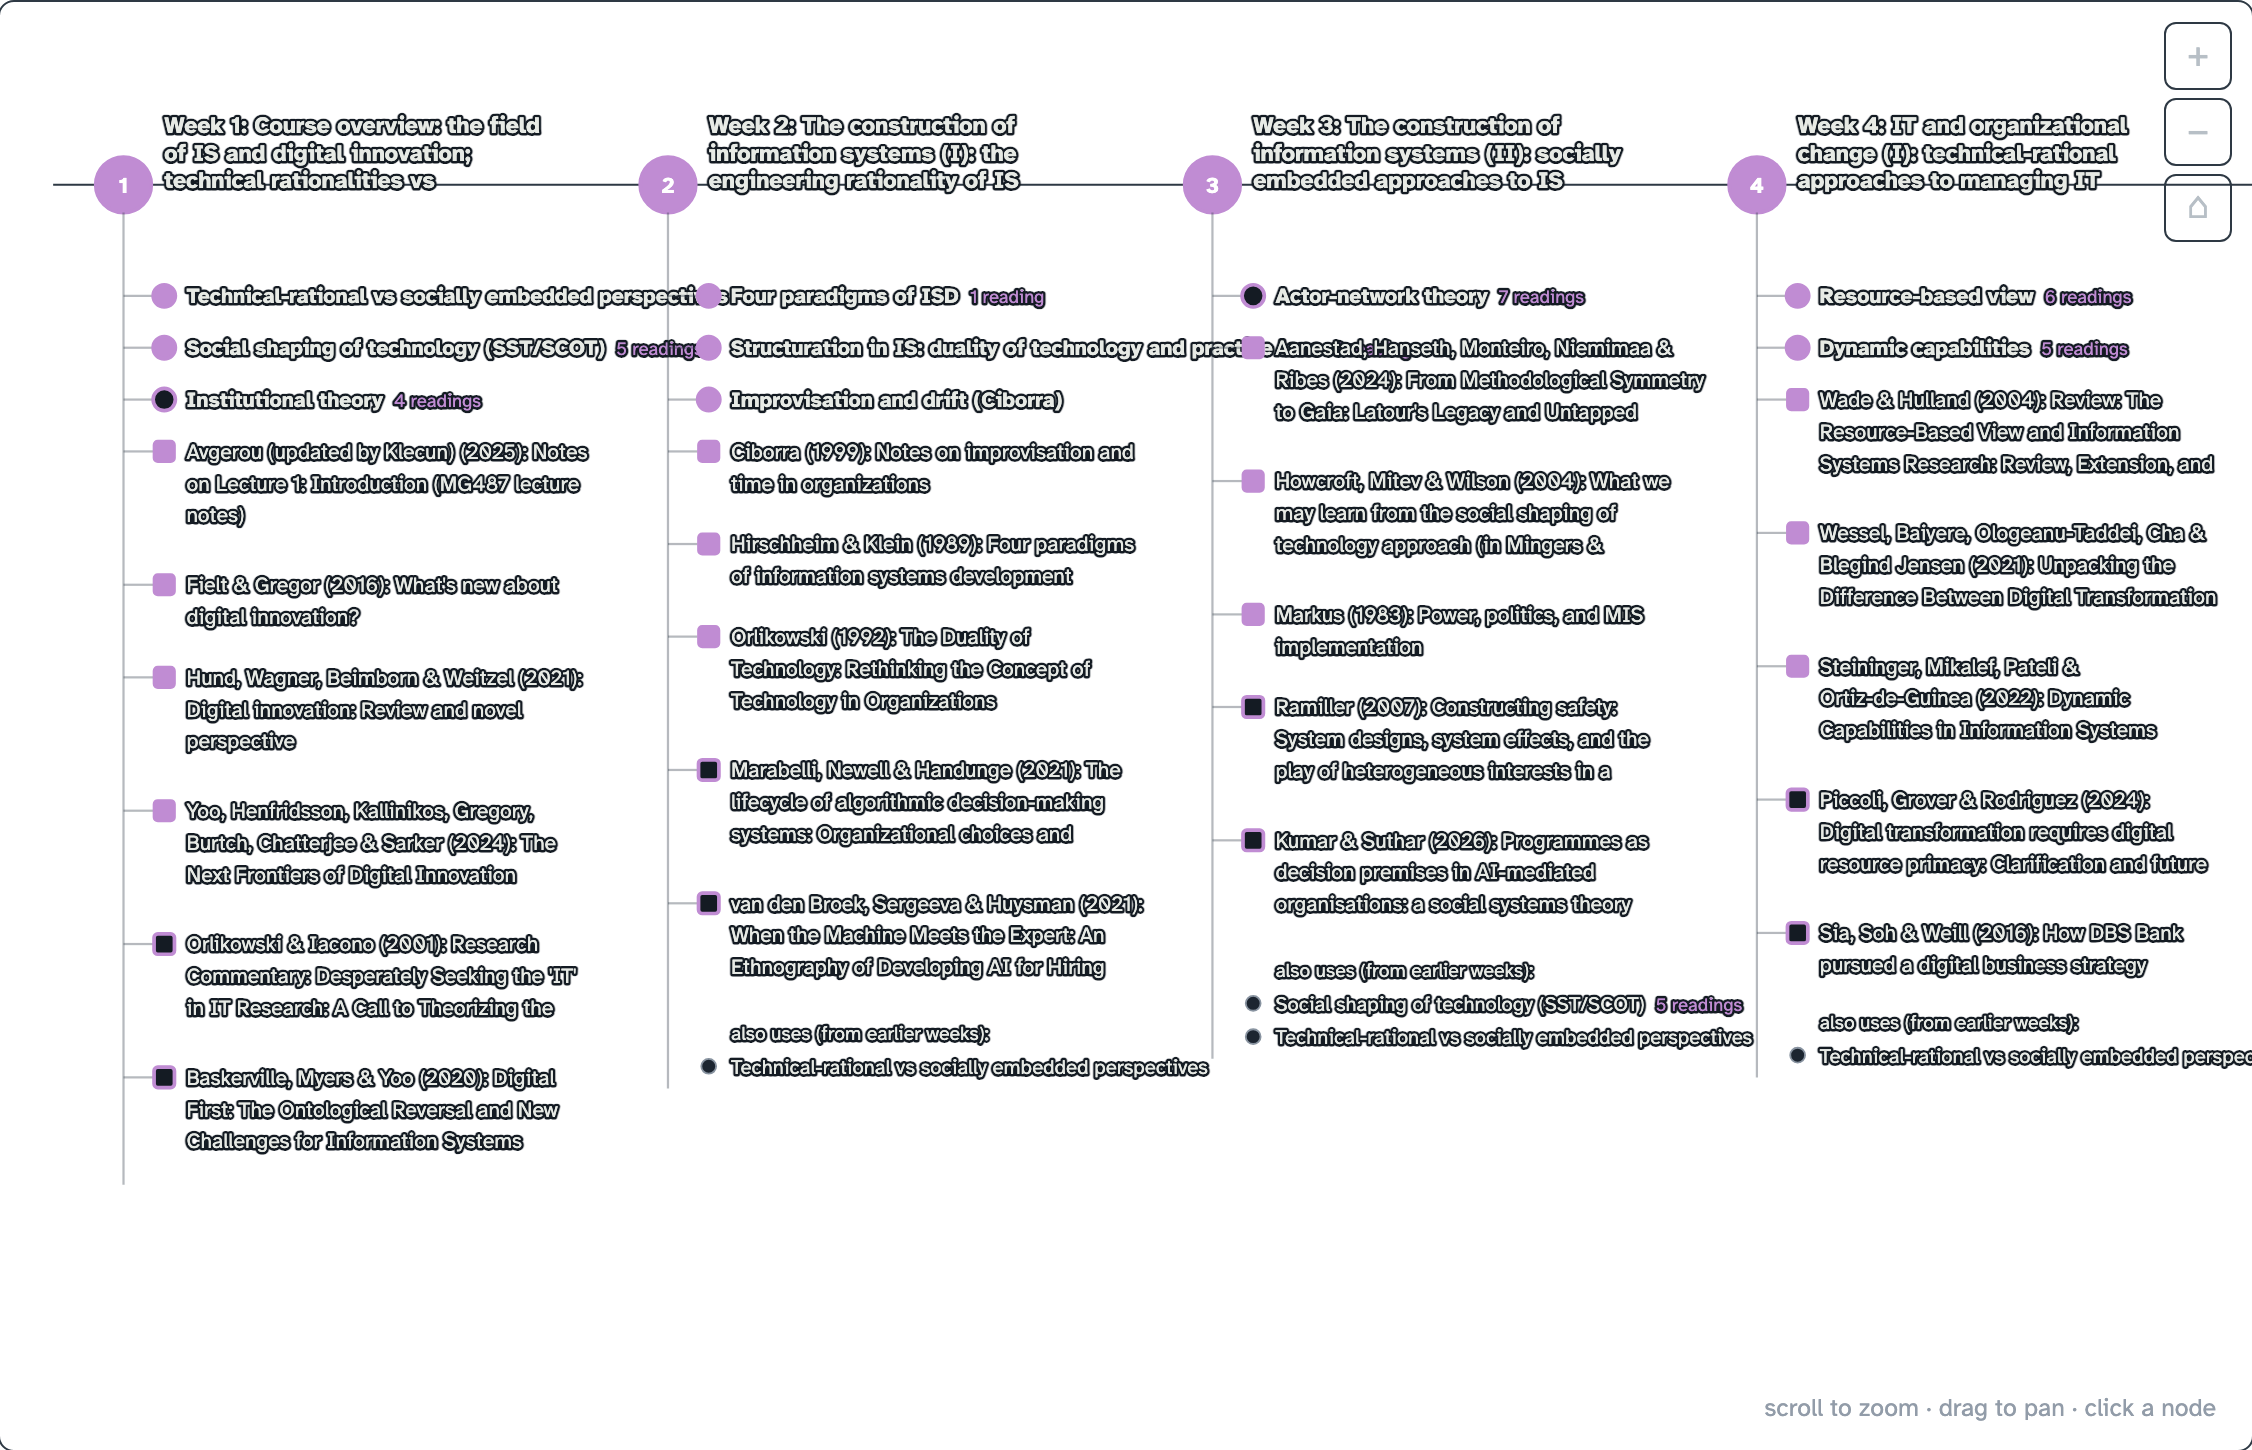
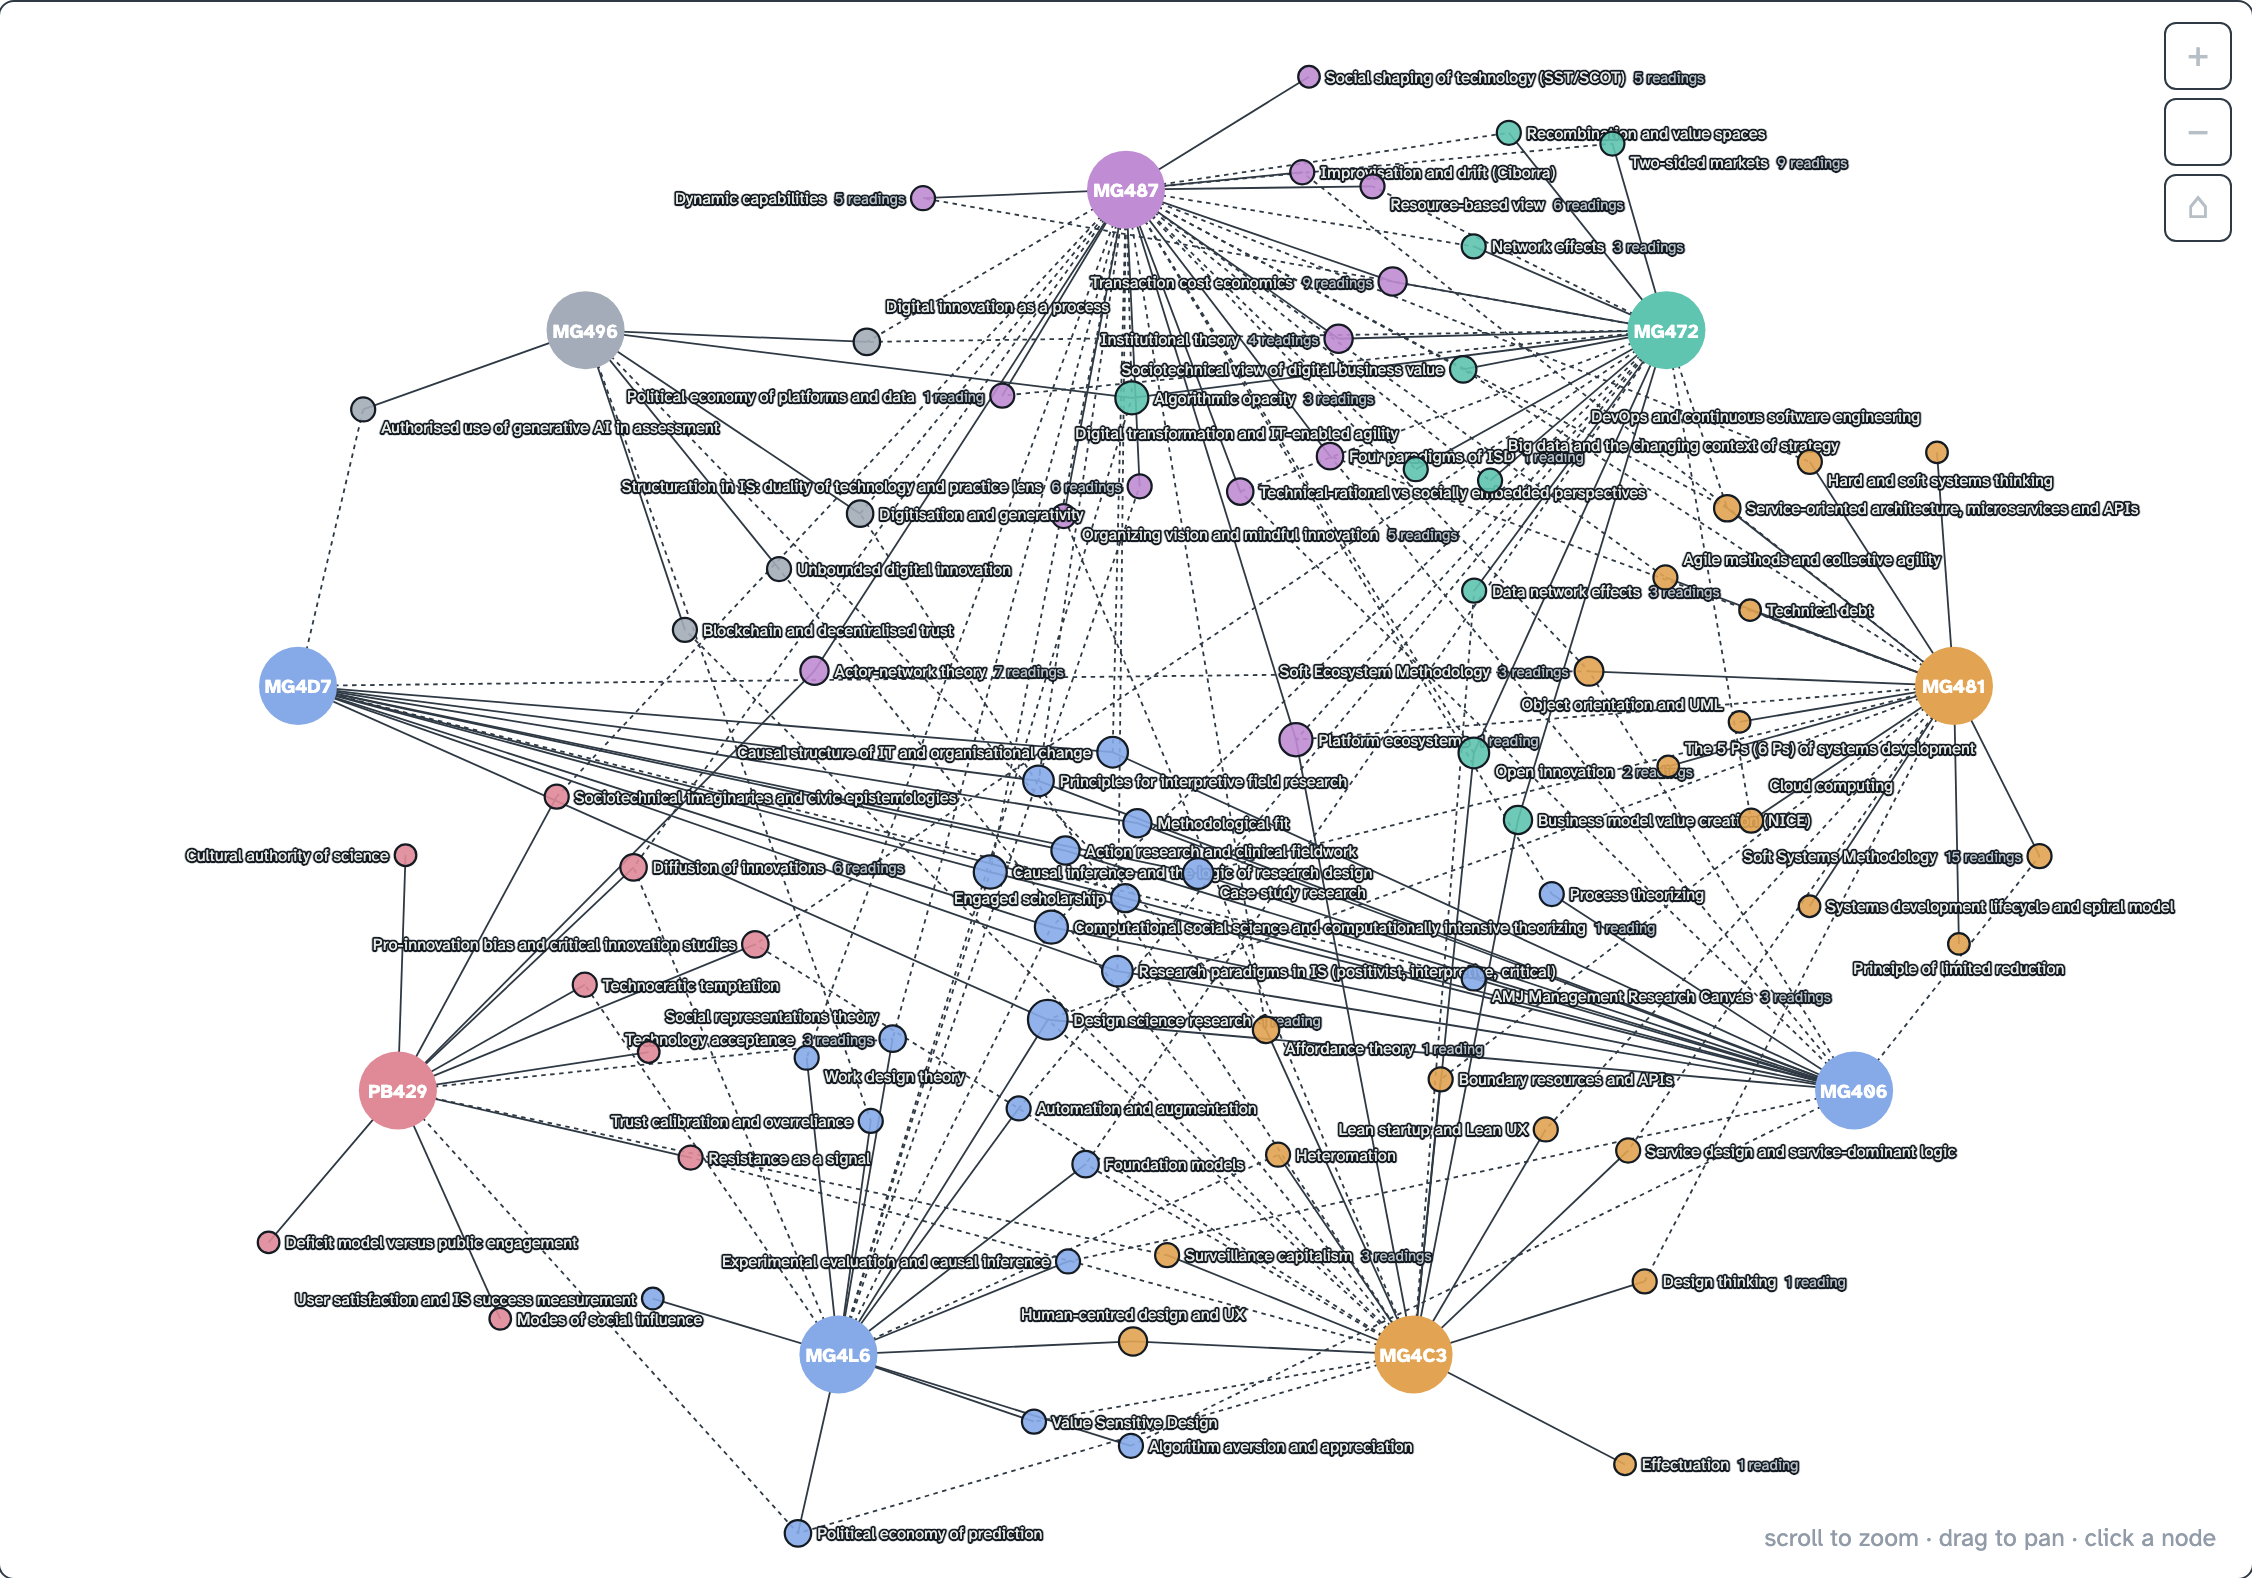
- Compass map, overlap matrix, theory glossary, theory network, concept maps per course and a year timeline.
- Search
- A reading index across all notes, with links between papers that share a theory.
- Build
- A Python script merges JSON dossiers and Markdown notes into one self-contained HTML file.
- Graphics
- All maps are SVG with one shared zoom and pan engine and labels that avoid each other.